What Is a Waveform?
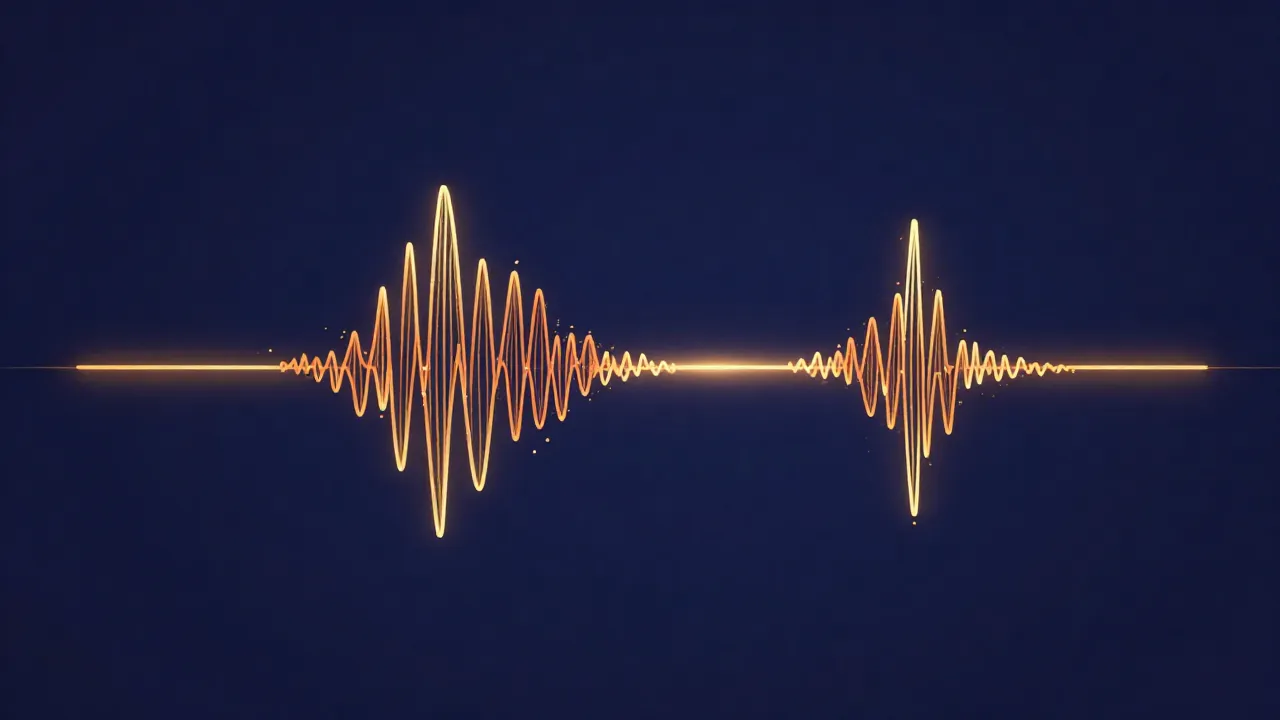
A waveform is a visual plot of a sound's amplitude over time — a squiggly line that gets taller where the audio is louder and flatter where it's quieter. It's the picture you see filling the track in every audio editor, and once you know how to read it, you can spot cuts, silences, beats, and problems at a glance without pressing play.
That's the whole idea in one sentence: time runs left to right, and loudness runs up and down. Everything else below is just detail on how to use that.
What the shape actually represents
Sound is a pressure change moving through the air, wiggling back and forth many thousands of times per second. When a microphone captures it, that wiggle becomes a stream of numbers — the sample values. A waveform is just those numbers drawn as a graph.
The horizontal axis is time. The far left of the display is the start of the clip; the far right is the end. Scroll or zoom and you're moving along the timeline, exactly like scrubbing playback.
The vertical axis is amplitude — how far the pressure (and so the signal) swings away from silence, in either direction. A value of zero sits on the centre line and means no signal at that instant. Big swings above and below the line mean a strong signal. Because the wave swings both up and down, most editors draw it as a mirrored shape around the centre, but the two halves are telling you the same thing: how big the movement is right now.
Zoom in far enough and you'd see the individual wiggle — the actual oscillation. Zoom out to see a whole song and those wiggles blur into a solid filled shape whose outline traces how loud the music is moment to moment. That outline is what people usually mean when they talk about "reading the waveform."
How to read one
Here's the practical translation, and it's short:
- Tall = loud. A chorus, a drum hit, a shout — anything with energy pushes the wave toward the top and bottom of the track.
- Short = quiet. A whispered word or a soft passage stays close to the centre line as a thin ribbon.
- Flat line = silence. A dead-straight line on the centre means there's nothing there — a gap, a pause, or trimmed dead air.
- Sudden spikes = transients. A sharp, near-vertical jump is a transient: the attack of a snare, a plucked string, a consonant at the start of a word. These crisp peaks are how editors find the exact moment a beat lands.
Put those together and a waveform becomes readable like a sentence. A podcast recording looks like clumps of medium-height texture (speech) separated by flat runs (pauses). A dance track looks like an evenly spaced picket fence of tall transients (the kick drum). A quiet intro that explodes into a chorus looks like a thin ribbon that suddenly balloons.
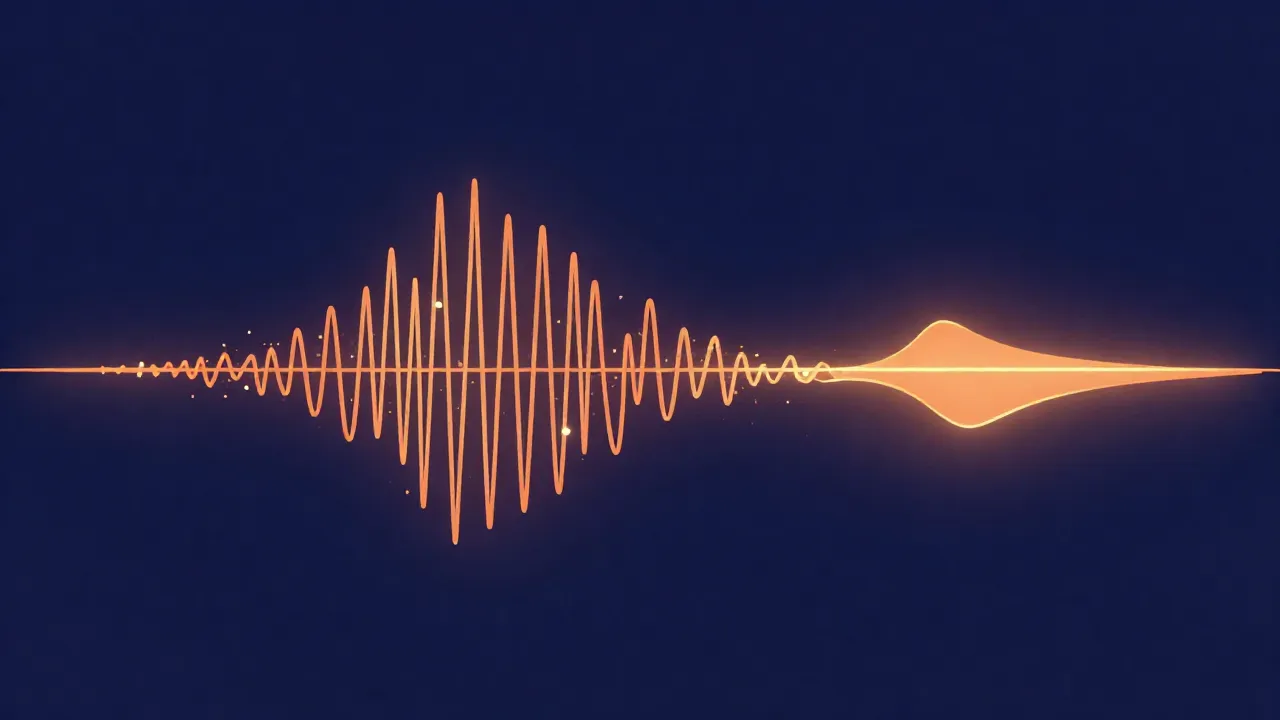
One shape worth learning to recognise early: when the tops and bottoms of the wave stop being rounded and become hard, flat plateaus, the signal has hit its ceiling and is being squared off. That's audio clipping — the loud parts have been flattened because they ran out of headroom, and it usually sounds like crackle or distortion. The waveform shows it before your ears might, which is one of the most useful things a picture of your sound can do.
Amplitude over time, not pitch
Here's the single most common misunderstanding, so it's worth stating plainly: a waveform shows level over time, not pitch. A tall part isn't a high note — it's a loud moment. A short part isn't a low note — it's a quiet one. A tuba playing loudly makes a taller wave than a piccolo playing softly, even though the piccolo is the higher-pitched instrument.
That's because the standard waveform is a time-domain view. It answers "how loud, and when?" It deliberately doesn't answer "which frequencies?" You genuinely cannot tell a bass note from a cymbal just by looking at the height of the wave — both can be tall or short depending only on volume.
To see pitch and frequency content, you need a different picture entirely: a spectrogram. A spectrogram keeps time on the horizontal axis but replaces amplitude on the vertical axis with frequency, using colour or brightness to show how much energy sits at each pitch. Low rumble sits at the bottom, hiss and sparkle at the top. It's a frequency-domain view.
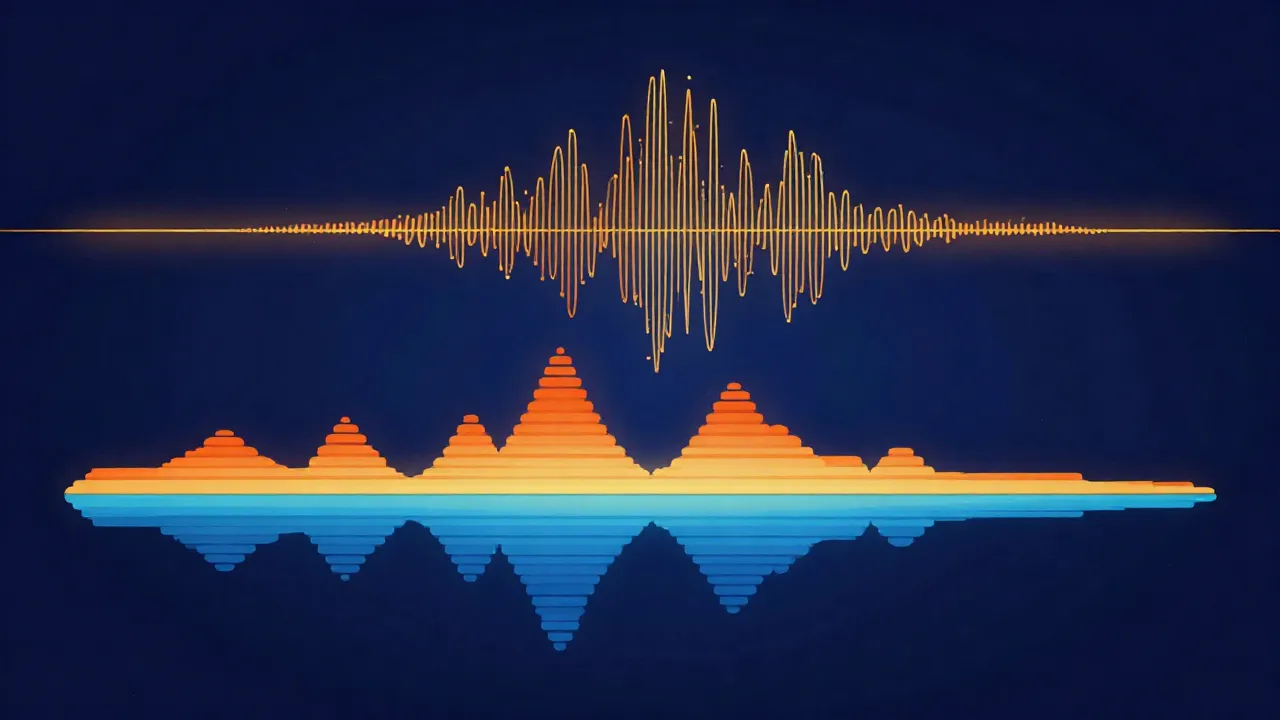
Neither view is more "correct" — they're two windows onto the same audio. The waveform is unbeatable for where things happen in time, which is why it's the default in an editor. The spectrogram is unbeatable for what frequencies are present, which is why it's the tool for chasing down a hum, a resonance, or a noise. Same sound, two axes. Most of the time you'll live in the waveform and reach for the spectrogram only when a problem is about frequency rather than timing.
How editors actually use it
Nearly every hands-on audio edit starts with reading the waveform, because it turns listening into looking. A few of the everyday jobs it makes fast:
- Finding cut points. You can see exactly where one word ends and the next begins, or where a musical phrase lands, and drop your edit on the gap between them instead of hunting by ear. That's the whole workflow behind trimming a clip — the waveform is the map you cut along. (More on doing it cleanly in how to cut audio without losing quality, and you can try it in the browser with the audio cutter.)
- Removing silence. Those flat centre-line stretches are dead air, and they're obvious on sight. Trimming the pauses between takes, or tightening the gaps in a podcast, is really just deleting the flat parts — which is exactly what a silence remover automates. There's a full walkthrough in how to remove silence from audio.
- Spotting clipping and level problems. Before mastering or exporting, a quick scan for flattened tops or a wave that's slammed against the ceiling tells you whether you've got headroom to work with or damage to fix.
- Lining up beats and syncing. The tall, regular transients of a kick or snare are visual metronome marks. Matching them up is how you align two clips, tighten timing, or line a track to a grid.
- Confirming a reverse. When you reverse a clip, the waveform flips left-to-right — the sharp attack that was at the front of a note ends up at the back, and you can literally see the edit took before you hear it.
In every case the point is the same: the waveform lets you make decisions with your eyes, then confirm them with your ears, instead of doing everything blind.
The takeaway
A waveform is amplitude drawn against time — loud is tall, quiet is short, silence is flat, and sharp spikes are transients. It tells you when and how loud, but not what pitch; for that you switch to the frequency-domain view of a spectrogram. The two are the same sound seen through different windows, and knowing which window to open for which question is most of what "reading your audio" comes down to. It's also worth remembering the shape is downstream of technical choices like sample rate and bitrate — those numbers are describing the very wiggle the waveform draws.
Every tool mentioned here runs on vocalcut.com free and entirely in your browser, with no upload and no account — your audio never leaves your device.
Frequently asked questions
Does a waveform show pitch or frequency? No. A standard waveform is a time-domain view: it shows amplitude (loudness) over time, not pitch. A tall section means a loud moment, not a high note. To see which frequencies are present in a sound, you need a spectrogram, which plots frequency on its vertical axis instead of amplitude.
Why does my waveform have flat lines in it? A dead-straight line sitting on the centre means there's no signal there — silence. It could be an intentional gap, a pause between words, dead air at the start or end of a recording, or a section that was already trimmed. Those flat stretches are exactly what silence-removal tools look for and cut out.
What do the tall parts of a waveform mean? Height represents amplitude, so tall parts are the loud moments: choruses, drum hits, raised voices, sudden emphasis. Very sharp, narrow spikes are transients — the crisp attack of a beat or a consonant. If the tops of the wave look flattened into hard plateaus rather than rounded peaks, that's clipping, meaning the signal was too loud and got distorted.
Is a waveform the same as a spectrogram? No, they're two different views of the same audio. A waveform plots loudness over time and is best for finding when things happen — cuts, beats, silences. A spectrogram plots frequency over time using colour for intensity and is best for seeing what frequencies are present — useful for tracking down hum, hiss, or resonance. Editors use the waveform by default and switch to the spectrogram for frequency-specific problems.