What Is a Spectrogram?

A spectrogram is a visual map of sound that shows which frequencies are present at each moment in time, and how strong each one is. Time runs along the bottom, frequency runs up the side, and the brightness or colour of each spot tells you how loud that particular frequency is at that particular instant. In one picture, it lays out the entire frequency content of a recording as it unfolds — a low rumble shows up as a bright band near the bottom, a bright cymbal splashes colour across the top, and a silence leaves a dark gap.
If a waveform tells you how loud a sound is from one moment to the next, a spectrogram tells you what the sound is made of. That extra dimension is why it's the view engineers, forensic analysts, and AI audio models all reach for when they need to understand a recording rather than just play it.
The three things a spectrogram shows at once
Every spectrogram packs three separate measurements into a single flat image, and once you know which is which, reading one becomes intuitive.
- The horizontal axis is time. Left is the beginning of the clip, right is the end — exactly like a waveform or a video timeline. Scrub left to right and you're moving forward through the recording.
- The vertical axis is frequency, usually measured in hertz. Low notes and bass sit near the bottom; high notes, hiss, and cymbals sit near the top. A single sung note appears as a horizontal line at whatever pitch it's holding.
- The colour or brightness is intensity — how much energy exists at that frequency and time. Conventions vary: some spectrograms go dark-to-bright, others run through a colour scale from cool to hot. Either way, brighter or hotter means louder.
So a single point on a spectrogram answers a very specific question: at this instant, how much of this exact frequency is present? Stack millions of those points together and you get a portrait of the whole sound. A held piano chord shows up as a set of stacked horizontal lines; a snare hit shows up as a brief vertical smear that spans a wide range of frequencies all at once; a slow filter sweep shows up as a bright band gliding upward over time.
How it's different from a waveform
This is the comparison that makes spectrograms click, because a waveform is the view most people already know — the jagged line you see in every audio editor. The two are not rivals; they're two windows onto the same sound, each throwing away different information to make something else easy to see.
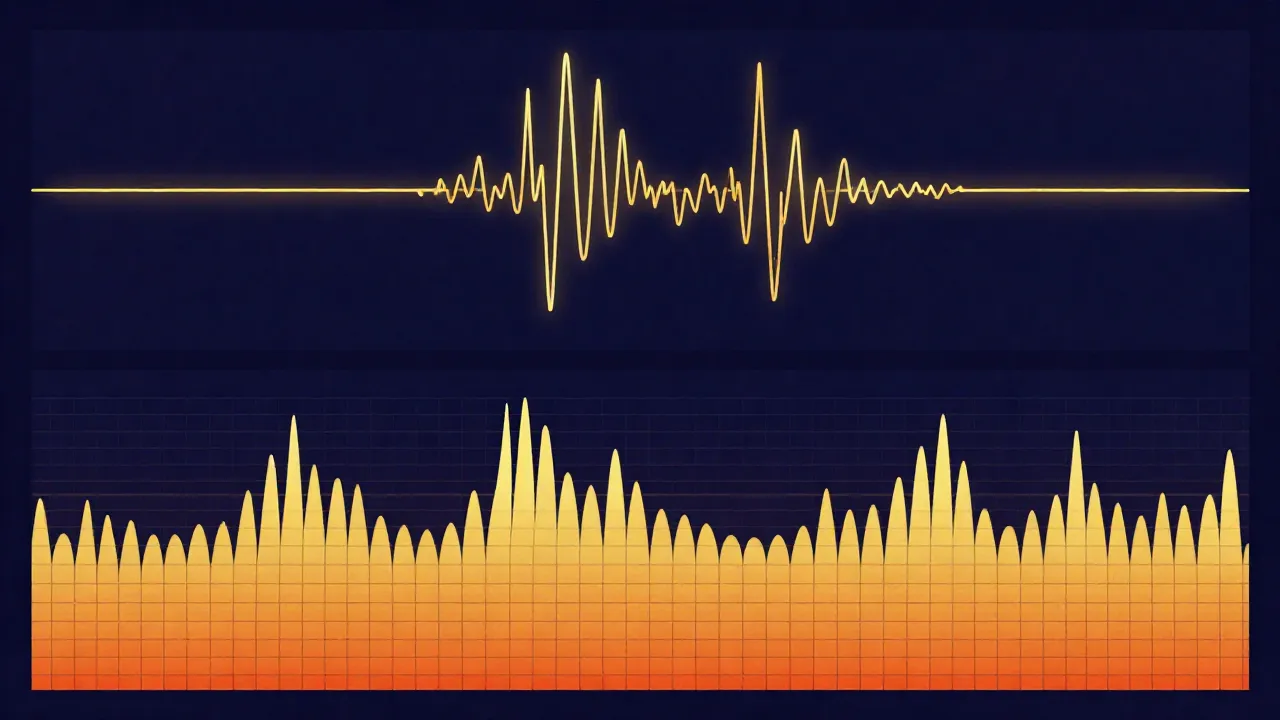
A waveform plots amplitude over time — a single line whose height at each instant is how far the speaker cone would push at that moment. It's fantastic for seeing structure at a glance: where the loud parts are, where the silences fall, where a beat lands. You can spot the edit points for cutting a clip instantly. But a waveform is frequency-blind. A deep bass note and a bright violin can trace the exact same squiggle if they're the same loudness; the line can't tell you which it is.
A spectrogram plots frequency over time, and pays for that by being harder to skim for pure loudness. What it gives you in return is the entire tonal makeup of the sound. Where a waveform shows one hump, a spectrogram shows you that the hump was, say, a low kick drum plus a mid-range vocal plus a sizzle of hi-hat — three things a waveform blurs into one.
Under the hood, a spectrogram is built from the waveform by chopping the audio into many short, overlapping slices and running a mathematical transform (the Fourier transform) on each slice to measure how much of every frequency it contains. Each slice becomes one thin vertical stripe of the image, and lining the stripes up in time produces the full picture. Nothing new is added to the sound — the spectrogram is just the same data re-projected so a different truth becomes visible.
What a spectrogram lets you see
Because it exposes frequency directly, a spectrogram makes several things obvious that are nearly invisible on a waveform.
Harmonics and pitch. A musical note isn't a single frequency — it's a fundamental plus a ladder of overtones stacked above it at regular intervals. On a spectrogram those overtones appear as a set of evenly spaced horizontal lines, and their spacing is the signature of the note. This is the same frequency structure a key finder leans on when it estimates a song's key from its pitch content.
Noise, hum, and unwanted tones. A constant electrical hum from bad grounding shows up as a razor-thin horizontal line sitting at a fixed frequency (often 50 or 60 Hz and its multiples), running the entire length of the recording — impossible to miss on a spectrogram, invisible on a waveform. Broadband hiss shows up as a dim haze smeared across the high frequencies. Seeing the problem this clearly is the first step to removing it.
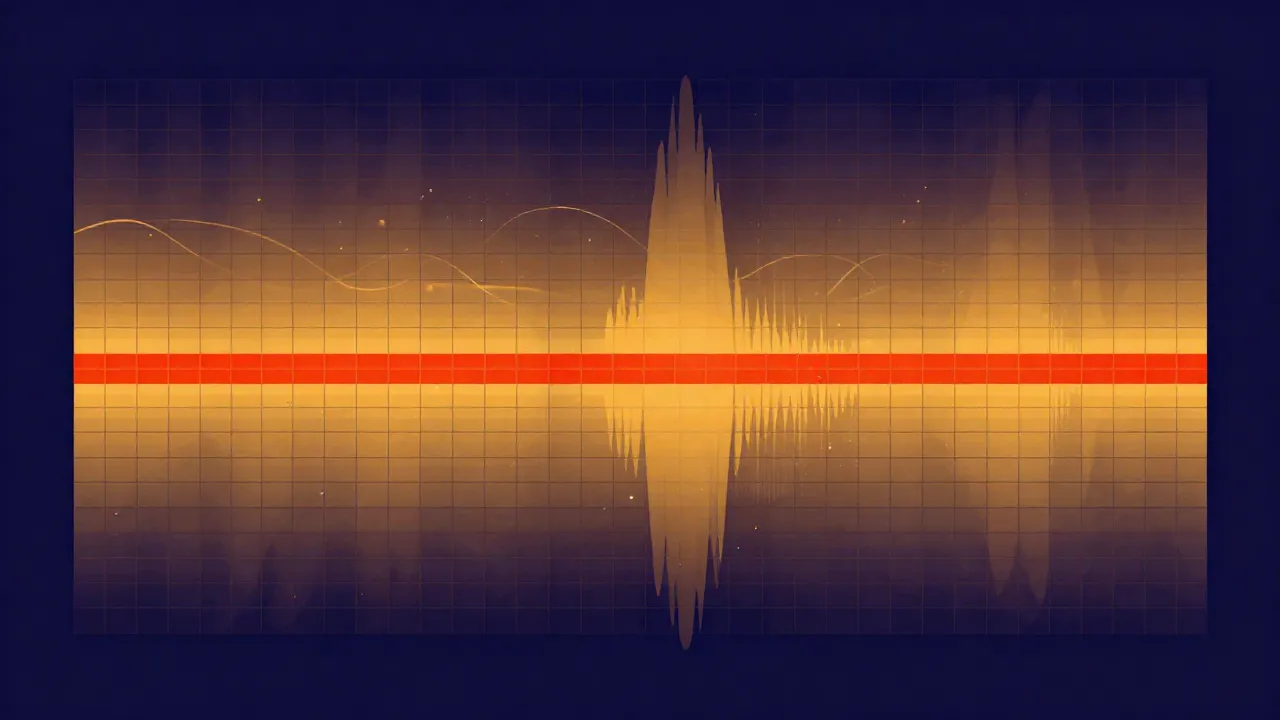
This is exactly why a spectral view is such a useful companion to cleanup work. When an AI noise reducer targets a voice recording, or when spectral noise reduction attacks steady background noise, it's operating on this frequency picture — deciding which time-and-frequency regions are signal worth keeping and which are noise to attenuate. A hum sitting on one thin line can be notched out surgically precisely because the spectrogram shows it living in one narrow band and nowhere else.
Overlap between instruments. When two sounds occupy the same frequencies at the same time, they collide on the spectrogram — their bands merge. That visual overlap is the same ambiguity that makes some audio tasks genuinely hard, which brings us to the biggest modern use of the frequency view.
Where spectrograms actually get used
The spectrogram isn't just a diagnostic readout; for a lot of modern audio software it's the workspace the actual processing happens in.
AI source separation. Splitting a finished song back into vocals, drums, and bass happens almost entirely in the frequency domain. The audio is turned into a spectrogram, and a neural network learns to decide, for every tiny patch of time and frequency, which instrument it belongs to — then keeps or discards that patch accordingly. That patch-by-patch decision is the "masking" mechanism, and how AI vocal removal actually works walks through it in full. The practical payoff is tools like a stem splitter that separates a track into independent parts, or a vocal remover that pulls just the voice out — both reasoning about the song as a spectrogram rather than as a raw waveform. If you want the broader picture of what those separated parts are, audio stems covers the concept.
Forensics and analysis. Because a spectrogram reveals detail the ear can miss, it's a standard tool for authenticating recordings, identifying background sounds, spotting where a file has been edited or re-encoded, and analysing everything from birdsong to sonar. A lossy MP3, for instance, leaves a tell-tale flat ceiling near the top of the spectrogram where high frequencies were discarded to save space — a giveaway that the file was compressed, even if it sounds fine.
Mixing and restoration. Engineers use spectrograms to hunt down problem resonances, find a rogue click or pop, and see exactly where two instruments are fighting for the same frequency range so they can carve space for each. It's the difference between guessing at a problem by ear and pointing straight at it.
None of this replaces listening — a spectrogram can't tell you whether a mix feels right. But as a way to see inside a sound, it's the single most information-dense view audio has, and it quietly underpins a surprising share of the tools people use every day.
Frequently asked questions
What is the difference between a spectrogram and a waveform? They show the same sound two different ways. A waveform plots loudness (amplitude) over time — the familiar jagged line — and is great for seeing where the loud and quiet parts are, but it can't tell a bass note from a treble note. A spectrogram plots frequency over time, using colour or brightness for loudness, so it reveals exactly which pitches and tones are present at every moment. Use a waveform to navigate; use a spectrogram to understand what the sound is made of.
How do you read a spectrogram? Read it like a graph with three dimensions. Left-to-right is time, bottom-to-top is frequency (low sounds low, high sounds high), and the brightness or colour of each spot is how loud that frequency is at that moment. A horizontal line is a sustained pitch, a vertical smear is a percussive hit that spans many frequencies at once, and a thin steady line running the whole width is usually a constant tone like electrical hum.
Can you turn a spectrogram back into audio? Partly. A spectrogram usually stores only the magnitude of each frequency and drops the phase information, so reconstructing the exact original waveform isn't perfectly possible from the picture alone — algorithms have to estimate the missing phase, which introduces small artefacts. This is one reason AI separation results aren't bit-perfect: they rebuild audio from a modified spectrogram and have to reconstruct what was thrown away.
Why does my MP3 show a flat line across the top of the spectrogram? That flat ceiling is the signature of lossy compression. Formats like MP3 and AAC save space by discarding the highest frequencies, which most people can't hear clearly, so the spectrogram simply goes dark above a cutoff (often around 16–20 kHz depending on the bitrate). A true lossless file like WAV or FLAC fills that region with real content. Spotting the ceiling is a quick way to tell whether audio was ever compressed.